Adapted from Frequently Asked Questions about Monitored Natural Attenuation in Groundwater (Adamson and Newell 2014)
One of most common lines of evidence for evaluating monitored natural attenuation (MNA) is using long-term contaminant monitoring data to determine attenuation rates, with positive evidence illustrating the loss of contaminant mass and plume stabilization. Monitoring records may be relatively short at many sites, however, covering perhaps only a few years and only rarely extending to the time of the release. Given the natural variability in groundwater monitoring data, these limited and temporary records may be insufficient for establishing decreasing concentration trends that support the use of MNA, or to demonstrate long-term source zone attenuation.
There are two innovative characterization methods that can, in some cases, reconstruct a concentration history that predates groundwater monitoring. These methods involve collecting high-resolution data in a diffusion-based medium, either from trees or low-permeability zones. These two methods are discusse
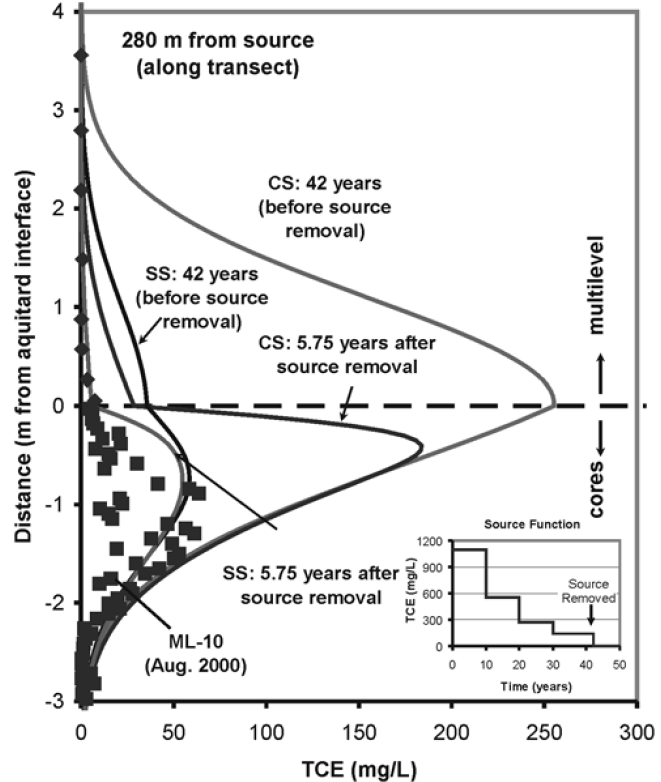
Figure H-1. Example of source history derived from coring an aquitard. The soil profile from the silty clay interval (black squares) is used to estimate the concentration vs. time in the overlying aquifer. Four different inputs to a one-dimensional diffusion model were used to make the four solid lines: CS = constant source; SS = stepped declining source. The concentration history shown as an inset resulted in the best simulated match to the data, and is labeled “SS: 5.75 years after source removal.” This SS starts out at near solubility concentrations, but declines by half every 10 years (t1/2 = 10 years).
Source: Chapman and Parker 2005
This method makes use of the contaminant mass that has migrated (via diffusion and slow advection) into and out of low-permeability geologic strata within a source zone or plume during the period following release (Chapman and Parker 2005; Newell et al. 2013; Liu et al. 1999). Detailed high-resolution soil concentration profiles within the low-permeability zones are obtained and serve as fingerprints of the source loading (concentration versus time), extending back to the origin of the source. The shape of the soil concentration profile can be used to reconstruct this source history using simple analytical or more complex numerical models. These methods are being demonstrated as part of an ongoing project funded by the Environmental Security Technology Certification Program (ESTCP 2013), a user-friendly source history software tool and field manual.
Trees in contact with shallow groundwater can take up contaminants during transpiration such that accumulation of these contaminants can occur during the year(s) of exposure. As a result, annual tree ring data can provide a quantitative indicator of changes in contaminant concentration over time (Vroblesky 2008; Balouet et al. 2009; Burken et al. 2011). The study of historical effects on tree ring chemistry, known as dendrochemistry, is one of several phytoforensic methods that can rapidly generate valuable site characterization data at some sites. The depth of the tree roots and depth to groundwater are very site-specific, however, and this technique is not applicable for all sites.
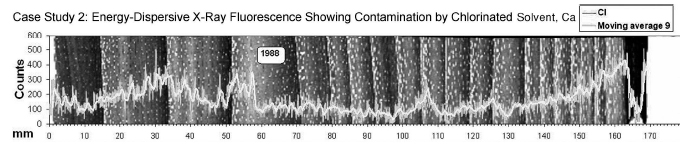
Figure H-2. Chloride patterns (shown on y-axis as x-ray fluorescence counts) over time in tree core (shown on x-axis in millimeters of core). The pattern identifies potential exposure events (releases) in 1988 and 1993/1994, along with continuing impact at dates when the core was collected (far right hand side) (Balouet et al. 2009).
Dendrochemical investigations require the collection of deep cores from trees that are scanned using energy diffusive x-ray fluorescence. Elements are quantified and used as surrogates of particular contaminants—including chlorine for halogenated contaminants (chlorinated solvents) and sulfur for crude oil and petroleum products. While factors such as degradation and naturally occurring variation can confound data interpretation, controls are used to better understand background patterns of targeted elements. The methodology is generally well developed and has been applied at more than 20 sites.